
What is the size of the global light- and neutron source research communities?
Adventures in bibliography Part I:
Uncovering the global status quo
By Martin Stankovski and Farhad A. P. Khotbehsara
(20 min read)
This article is best viewed in landscape mode on a larger display.
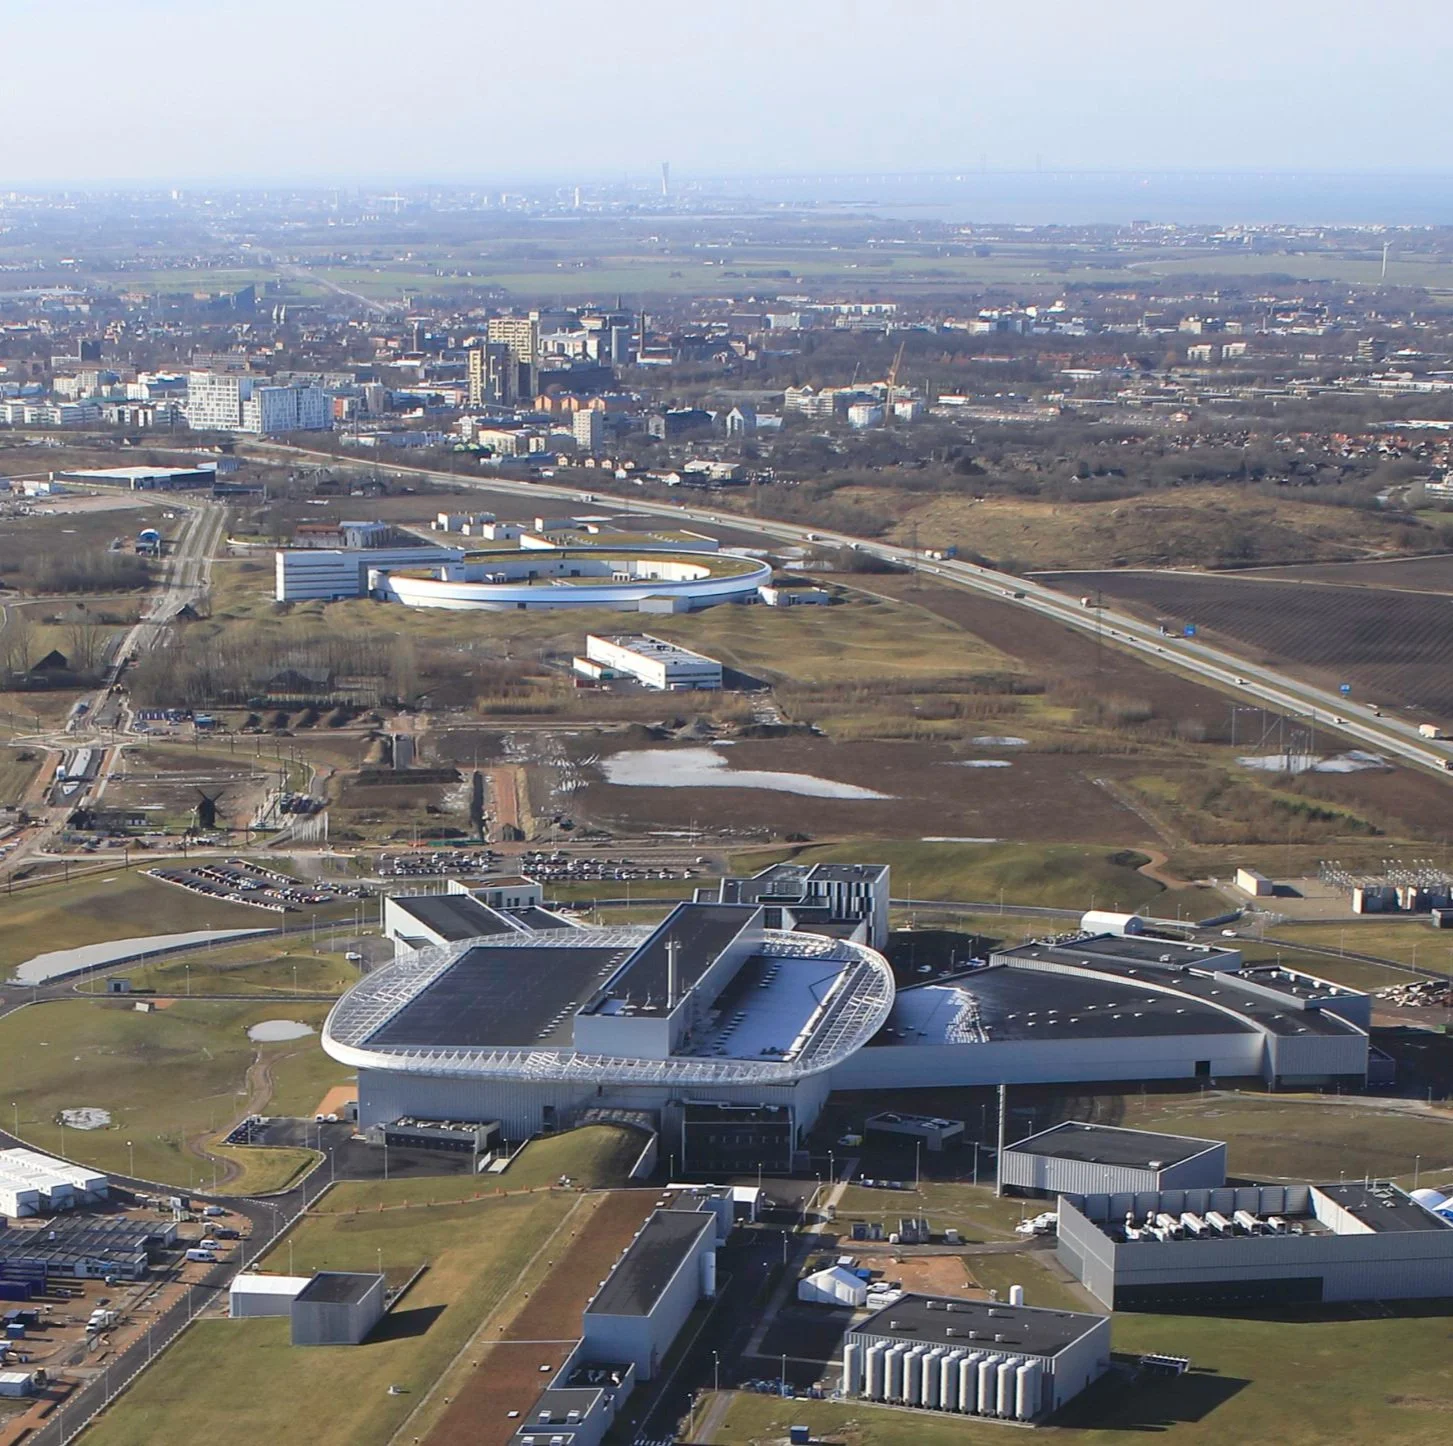
Aerial view of the European Spallation Source ESS (foreground), and the MAX IV Laboratory (ring shaped building further back) taken in February 2022. The area between is known as the Science Village and is now under intense development.
Large scale research infrastructures, so called LSRIs, are sizeable national and international investments. Though there is no unified definition of the term LSRI, what they have in common is that they often require investment at the national or international level. They also require extensive planning, time, and expertise to build and operate.
The relatively small country of Sweden hosts a freshly upgraded national facility called the MAX IV Laboratory, the first worldwide realisation of a fourth-generation light source. This type of facility uses intense beams of light generated when electrons are accelerated near the speed of light. The fourth generation represents a big step in the power, brightness and quality of light that can be squeezed out of the electrons. This technology, which was pioneered in Sweden at the predecessor MAX-lab, is now being replicated all over the world.
In a synergistic move, Lund was also chosen as the site for the European Spallation Source (ESS). This is an internationally funded, multi-disciplinary research facility based on what will become the world’s most powerful neutron source when it opens. The facility also uses an accelerator. In this case, the accelerator is for protons, particles which live in the nucleus of atoms. Smashing these protons into atoms of a particular element releases powerful beams of neutrons, which are the other main resident in atomic nuclei. Neutrons have no charge and can therefore travel deep into matter to probe it.
Neutrons and light are highly complementary when it comes to investigating matter, since they can “see“ through it and interact with it in very different ways. These facilities are thus jointly capable of giving researchers a whole range of options and approaches when it comes to solving their questions. This is why they are worth the cost.
But what is that cost? The price tag for the construction of MAX IV was about 6 billion Swedish krona (about $711 million in 2015) and the corresponding bill for ESS 2014-2027 is €3,3 billion in 2013 Euros (about 28 billion Swedish krona, or $4,4 billion in 2013). Given this massive investment it is reasonable to ask: What is the return in terms of scientific and societal impact? What we are presenting here are first results of a journey to answer this question using an approach based on the historic published output enabled by these facilities.
The questions
There have been numerous studies and reports focused on this topic already, based around specific LSRIs or LSRI groupings. However, as far as we’re aware, none have so far been successful in systematically gathering all publications stemming from the global facilities and their user programs.
In 2022 the opportunity presented itself for us to attempt to do this, and for a good cause. We work in a department at Lund University where support and insight is often needed on demand and fast in order for leadership at all levels to make strategic decisions. To this end, we have access to several tools and data-gathering capabilities. What was unique about this problem was that the data set we would need to look at is not easily accessible in these tools.
The good cause in question was the recently-started national SPIRIT project. The project’s goal is to suggest how Sweden should shape a national innovation and collaboration arena between academia and industry connected to LSRIs. We had already established that most of the national competence needed to use LSRIs was based in academic environments. Since Martin also works as a strategic advisor for LINXS - an environment in which it is highly relevant to keep tabs on these questions - we decided to roll up our metaphorical sleeves and do the work. The key questions we set out to answer were:
What are the respective sizes of the global x-ray and neutron research communities?
What are their comparative sizes and distribution in Sweden?
We were of course also interested in the development over time and any further insights we could gain from answering the above. In discussion with the people working in SPIRIT, we decided to approach this in the simplest way possible, by collecting the corpus of publications that are connected to use- or development of x-ray, and neutron based LSRIs, and to provide some results from analysing the collected corpus as an in-kind contribution to the SPIRIT project. Papers have authors with their affiliations, so when we have a validated list of publications, we can map the participation by country, organisation, or people involved.
Getting the information
If you want to find out how an organisation like Stanford or other universities are doing in terms of their published output, you can easily select it as a corpus of publications in the tools and databases typically used by universities. At Lund University we have the luxury of choice between two of the largest such databases, Scopus, and Web of Science. However, if we want to look at the set of publications stemming from the use of LSRIs, we have no choice but to go to the websites of each of them and gather the publications by hand. This is because these facilities run User programmes and it is not necessarily the case that the facility itself is among the affiliations on publications resulting from experiments there.
There are other strategies that have been tried, such as searching for keywords or using acknowledgements, but they all have their flaws. Keyword searches need lots of fine tuning, and one can never be sure that the hit rate is good enough to capture everything. Both the false positives and negatives can have error bars that are very difficult to estimate. As for acknowledging LSRIs, in many cases users unfortunately fail to do this correctly or consistently when they publish, even though this is a requirement for access. The success in automated reading and classification of acknowledged entities in publications also varies, and is much less developed than that for authorship and affiliations.
For these and other reasons, a good old collection by hand - “from the horse’s mouth” so to speak (even if we’re talking about some massive, billion-euro horses) - was judged to be best. The strength of this approach is that most LSRIs keep track of and report, openly and transparently, which publications they can say their research environment has contributed to. They do this not least because it is often a requirement in the reporting to their various funding bodies, but also because most would emphatically agree that it is the right thing to do. Below is an illustration of the facilities included.


The data collection was done by Farhad, who has worked in a related way with mapping funding streams in Sweden. It helped that we both have a physics background and are at least literate, though by no means expert, in some of the science. We took our first cues for which facilities to include from the LEAPS and LENS sites and then worked to fill in which other major global facilities from various online listings. We took care to try to include all the largest currently active synchrotron and neutron-based facilities open for users. When possible, we also collected all data from older and no-longer-running facilities to get a historic picture that was as complete as we could make it.
We worked in two main rounds, with a first attempt in early autumn 2022, where we vacuumed up lists of publications that major LSRIs around the world provide through various web-based pages and resources. This enabled us to get a first estimate of the communities in the world and Sweden. It also enabled us to pinpoint and troubleshoot a few issues in the data collection and subsequent analysis.
One of these we faced initially was “contamination” by particle physics publications. Unsurprisingly, this comes about because particle accelerators are very much used in particle physics too. This is how synchrotrons and neutron facilities started, as offshoots from particle physics experiments. In some cases the same organisation is responsible for all types of facilities, and a quick-and-dirty grab of publication lists will have lots of particle physics ones included as well. There is a similar risk within the field of nuclear physics, where it can be very hard to disentangle publications in the field in general from those explicitly stemming from neutron-related LSRIs.
In an initial report, we did a quick fix by removing papers with 100+ authors, since these, with very few exceptions, tend to be particle physics papers. In a second round of improved data collection performed in March 2023, we took great care to collect at beamline/experiment level and to include the occasions where particle and nuclear physicists are proper “users” of x-ray and neutron facilities. The latter are more prominent when it comes to experiments relevant for particle physics, but they do crop up for x-ray sources too.
We also identified a gap in the part of the publication corpus associated with Asian facilities and made an extra effort to include more of these in the second round. China, for instance, has at least four major light sources, but publicly available publication lists are scarce, and getting increasingly harder to find. If the site hosting information could not be browsed in English or could not be successfully Google-translated so this could be done, it will not have been included in our study. The set we have gathered will thus be biased toward English-language publications and the global regions focusing on these, and we could not identify an easy way around that.
Another point of discussion was if we should differentiate between pure “user” papers, and papers related to basic science, methodology or technological development from staff at the facilities. We decided not to differentiate for now, because the latter type of work is also a concrete result of the investments in LSRI environments and very important in terms of their total scientific and societal impact, with global communities of researchers involved.
In spring 2023, by the end of the second round, we had collected the self-declared publication lists from 30 light sources (including x-ray laser sources) and 25 neutron facilities. All major global open-access light- and neutron sources were included.
We performed extensive cleaning of the data, taking care to identify unique Digital Object Identifiers (DOIs), and de-duplicating publications using Elsevier’s Scopus database and SciVal tools.
In the period from January 1996 to March 2023, 182 013 publications were identified as indexed in the Scopus database for light sources and 46 993 publications for neutron sources. Below are proportional Venn-diagram illustrations of the relative sizes and overlaps (i.e. papers based on experiments at both types of facilities), as well as graphs of the development of the corpus over time.


There are of course a lot of early facilities that are now closed that we have missed, although we have taken care to include those lists whenever they were available (e.g., we included NSLS and the MAX IV data includes MAX I-III). However, the further back in time we go, the less sure we can be that we have a truly comprehensive picture. For this reason we decided to limit the period for subsequent study to 10 years.
In the subsequent analysis, we included all publications published no earlier than 1st of January 2012 and no later than 31st of December 2021. We set the upper limit to just before 2022 because at the “bleeding edge“, close to the immediate period when you collect the data on publications (which we did in march 2023), there are still publications being registered, indexed and added to the full database. That is why there is a dotted line between the years 2022-2023 in the line graphs above. After some time back from the time of data collection, typically between 12-24 months, the numbers will have stabilised further.
The final tally of indexed publications in the 2012 – 2021 time frame was 107 781 for light source publications, and 27 302 for neutron source publications.
Analysis and key results
Now the detailed analysis could begin. With full data on the publications, we can look at the statistics related to global regions and countries.
What do we mean by participation? If a specific author on a publication is affiliated to an organisation in, say, Brazil, we chalk up one participation for Brazil. We also chalk up one participation for South America since Brazil is in that world region. If an author is affiliated to multiple organisations in various countries, each distinct country and related world region gets one participation chalked up for them. The participations counted therefore represent partially overlapping sets, which sum up to more than the total amount of publications in the period.
The most important thing is that participations are only counted once for each given entity for each paper. So if for instance there is a paper with authors that are associated to 3 organisations in Brazil, 2 in Germany, 4 in France, and 1 in Japan, the result is: 1 participation for Brazil, 1 for Germany, 1 for France and 1 for Japan. For world regions, there is 1 participation for South America, 1 for Europe, and 1 for Asia-Pacific.


Of course, we could look at many other things such as the number of (field weighted or non-weighted) citations, subject areas, first-and-last authors, impact factors, topic areas etc. We still can, but to answer the questions we set out to answer in the beginning, we decided to keep the quantities we looked at simple and robust. The total number of - and the participation in - publications are simple and easy-to-understand measures focused on published outputs, which most scientists would agree are a valuable result of their work.
These measures are simple, and so they do not suffer from specific issues, interpretations and disagreements that come about if one further tries to differentiate the corpus, e.g. using excellence measures based on citations, where there are differing citation practices in different communities, whether including self-citations or not. These can be field-weighted, but then there are issues connected to the correct identification of fields and their relative sizes which makes comparison of field-weighted citation statistics problematic between fields. How impact factors for different journals are determined and measured is not without its own issues, and finally all the hitherto mentioned indicators change over time and depend on when you determine them. Another differentiation can be made on authors and their ordering, but the culture for this also varies between scientific communities.
Finally, we will of course be the first to admit that neither of us does research in bibliometrics for a living. We only have a bit more than the practical knowledge that you would expect from any scientist who has published papers. This was another reason to keep it simple, both for us and the community.
To move on, we looked specifically at the top 25 globally for two categories:
1) the absolute size participation in the identified light-source and neutron source corpuses respectively, and;
2) participation per capita, where the average population in the 2012-2021 period was used for each country.


Acoording to the current data we gathered, Sweden ranks second worldwide in per-capita participation in light source communities and third in neutron source communities, following Switzerland. Switzerland funds the Paul Scherrer Institute (PSI), a host to three major types of facilities: a synchrotron (SLS), an x-ray laser (SwissFEL), and a neutron source (SINQ). Given Switzerland’s national commitments, the relative size of the country, and the scientific focus and investment in this type of science, it is not surprising that it comes out on top. Notably, Denmark is a close third (light sources) and fourth (neutron sources) just after Sweden in terms of per-capita participation rate, with about half the absolute number of participations, but also about half the population. Denmark’s investment in the ESS thus seems more than just a coincidence of proximity - there is also a strong research community there.
We can now compare the participations in light- and neutron source publications against the total number of publications Sweden participated in according to the Scopus database for the 10-year period of papers published 2012 to 2021.


Summary
Method
We have reported on the identification of publications self-declared by most major light- and neutron based LSRIs around the world. We made an effort to identify as many DOIs as possible, and to match them with those indexed in Elsevier’s Scopus database using the tool SciVal. Publications indexed in this database start from 1st of January 1996.
We compared the relative sizes of the light- and neutron based corpuses in the period 1996 to March 2023, as well as the overlap between them. We then looked at their development over time since 1996, and also at the same normalised to the overall corpus of scientific publications worldwide per year indexed in Scopus.
Main results
At its peak in 2015, the output related to light sources corresponded to 36 publications per 10 000 global outputs, this has been holding mostly steady with a small decline to 33 in 2019. For neutron sources, the peak was in 2017, corresponding to 9.7 per 10 000 global outputs, which has sunk a bit to 8.4 in 2019. In absolute terms, both the light source-based publications and the neutron ones kept rising in the period until 2020 (light) and 2018 (neutron), respectively.
The amount of publications in the total corpus reported as results at both light- and neutron facilities, i.e. the overlap between light- and neutron source corpuses, was just under 2% in total for the entire period of 1996 to March 2023. In 2019, until just before the pandemic, this had been steadily rising to about 1,2 out of every 10 000 world publications.
There is a marked drop in both absolute and relative terms from 2020 onwards, even relative to the world corpus, in all likelihood due to the pandemic and shutdown of major facilities around the world, as well as issues brought on by the energy crisis due to the war in Ukraine. Future updates of the data corpus will show if this persists.
For the outputs published in the period 2012 to 2021, we have also reported the participations per global region and country. For light sources, we found Sweden to be in seventh place in Europe in terms of absolute volume of participations and in 13th place globally. In terms of per capita participations, Sweden is in second place after Switzerland, and closely followed by Denmark in third place.
For neutron sources, Sweden is in 10th place in Europe, and 14th in the world in absolute terms, and in third place by capita, just after Switzerland and the Netherlands, and again closely followed by Denmark in fourth place.
About 1% of all Swedish scientific output participated in for the period are part of the light source corpus, and 0,3% of all Swedish participations are part of the neutron source corpus. This is a very high degree compared to the total scientific output of the country.
About 33% of Swedish participations in neutron source outputs are due to affiliation with the ESS, which is the largest single environment of neutron researchers in Sweden and Denmark. Some further data and reports related specifically to Swedish environments can be downloaded from the SPIRIT project website (NB website and reports in Swedish).
What’s next?
We must emphasise that this is a report on work in progress. Pending any feedback which requires correction we will update this post and try to be clear when and where we have done so. We feel that we have only really scratched the surface of what we can investigate, and we will eventually be looking to publish something together with authors working in the field.
We also want to maintain and update the collected corpus, create tools to track relevant developments, and see which trends we can identify. One thing we have already looked at is the connection between publications resulting from the use of light- and neutron based LSRIs and patents.
Preliminary analysis shows that light source LSRI publications have a most remarkably high relevance for patenting. We are now looking at the corresponding data for neutron sources, and this topic will be the subject of the next article.
Until then, dear reader, we hope you find peace in these stormy times,
Martin & Farhad
Acknowledgements
We would like to thank the working and steering committees of the SPIRIT project for useful discussions, in particular Fredrik Melander, who has worked a lot on policy connected to LSRIs as well as been involved in previous mapping efforts. We would also like to thank our Head of Unit Lisa Thelin, and the Director of LINXS Prof. Trevor Forsyth, for sponsoring these investigations. In addition, we would like to thank Marjolein Thunissen, Aymeric Robert, Anna Stradner and the LINXS staff for useful discussions and critical reading of the article draft prior to publishing. Thanks to Shandana Mufti in particular for her editorial contributions. We have used the Elsevier tool SciVal, to which Lund University subscribes, to perform the DOI identification, deduplication and identification of participation.
Finally, our deep thanks to all the LSRIs included in this study and their staff who diligently keep record of the publications associated to them to make all this information available and accessible online.
The main data processed in SciVal was downloaded from there between the 28th and 30th of May 2023, via http://www.scival.com. Some additional data was downloaded on the 15th of May 2024.
Corresponding author: Martin Stankovski
The slides used in this article are shared under the Creative Commons license Attribution-ShareAlike 4.0 International, CC BY-SA 4.0 for short. Below is a link to a pdf-file with all slides gathered:
Supplementary information: cleaning the raw data
In essence, we wanted all accurate and complete references to the publications, taking special care to identify DOIs of each publication. Where DOIs had not been provided, Farhad used semi-automated methods to search for and identify them, which was a major effort.
Since Martin had some previous experience with using the tools Scopus and SciVal (by Elsevier), we used those for the important work of deduplicating publications and authors and resolving the affiliations. One could also use, e.g., tools querying the CrossRef database to do the same. Duplication occurs because a user publication is often the culmination of a series of experiments, not necessarily all at the same facility, so there will be overlap in the lists from different facilities. Also, multiple beamlines/experiments at the same facility can be involved and so, quite rightly, be reported as a result for each of these.
An issue that comes up in cleaning the data is that DOIs are not always uniquely assigned. This is a well-known problem, which affects a small fraction of a percentage of publications. Also, the publication might just not have been put into the Scopus database, either by dint of issues with the publication outlet, or the type of publication.
In the end, 182 013 publications were identified as indexed in the Scopus database for light sources in the period from 1996 to March 2023, and 46 993 publications for neutron sources. At this point we have no duplicates, and the publications are all uniquely indexed so the analysis described above could take place.
For the next update of the dataset, we are working on improved methods to find and structure the reference data, and to address the issue of the few publications that have DOI which has been assigned to multiple publications.